
Making Sense of Complexity with Enterprise Architecture Diagrams
Enterprise architecture diagrams are essential for understanding complex IT infrastructures. They visually represent the various enterprise architecture components, including the data, applications, and technology infrastructure.

These diagrams help stakeholders understand how the different parts of the IT landscape interact and how they can be optimized to better serve the organization's goals.
These diagrams help stakeholders understand how the different parts of the IT landscape interact and how they can be optimized to better serve the organization's goals.
Businesses are becoming increasingly complex and interconnected, with various systems and processes working together to achieve common goals.
Enterprise Architecture (EA) is a discipline that provides a comprehensive approach to managing these complexities by aligning business strategies with technology capabilities. EA uses visual representations, including enterprise architecture diagrams, to give a holistic view of an organization's operations, processes, data, and stakeholders. These diagrams are designed to make complex information more accessible, understandable, and actionable to various stakeholders.
In today's article, you will learn about enterprise architecture diagrams, including types, their components, benefits, and best practices.
What is an enterprise architecture diagram?
An enterprise architecture diagram visually represents an organization's information system's structural components and interactions. It identifies, classifies, and relates data, processes, and applications that are part of a business's overall information architecture.
These diagrams are intended to develop an effective IT strategy by providing information on how different organizational units interact. As such, it is used as a guide for business process optimization, ensuring that all stakeholders understand how their operations fit into the more extensive system.
EA Diagrams can help organizations make more efficient workflows, reduce redundant processes, and better align technology investments with strategic goals by creating a comprehensive view of the organization's IT structure. EA diagramming is vital for architects, IT planners, and business leaders to align their strategies, make informed decisions, optimize IT investments, and drive organizational success.
From Concept to Reality: How Enterprise Architecture Diagram Standards Evolve?
Enterprise architecture diagram standards are guidelines that organizations use to create diagrams that accurately represent their business structure. These standards help ensure that all diagrams have consistent features and components regardless of who created them.
They also provide a common language for stakeholders to communicate about the organization's architecture. Some popular enterprise architecture diagram standards include ArchiMate, UML, BPMN, and Zachman Framework.
These standards enable organizations to illustrate their enterprise architecture visually and ensure that it remains consistent over time. By following these standards, organizations can easily understand the relationships between their systems and components to create an efficient business process.

Get a complimentary copy: 2024 Gartner® Magic Quadrant™ for Enterprise Architecture Tools
Importance of Enterprise Architecture Diagrams for Business
Enterprise Architecture diagrams can provide an overview of an enterprise's complex system components.
A simplified visual representation using graphical elements such as shapes, lines, and colors can quickly convey the relationships between systems, features, and data flows.
It can help to break down complex concepts and make them easier to understand.
This makes identifying potential issues in existing system architectures or troubleshooting faults easier. In addition, by breaking down the entire framework into smaller sections and visualizing the different elements clearly, stakeholders can better understand how their organization's IT infrastructure is performing and how to improve it.
Simplified visualizations are also helpful in communicating ideas to non-technical audiences, as they require less effort to assimilate.
Exploring Different Diagram Types for Architecture
Depending on a company's needs, different enterprise architecture diagrams can apply.
Each type has advantages for helping organizations understand their business and technology infrastructure and decide on future technology investments.
The five essential types of enterprise architect diagrams are:
1. Business Architecture diagrams:
These diagrams represent an organization's business aspects, including its goals, strategies, processes, functions, and stakeholders.
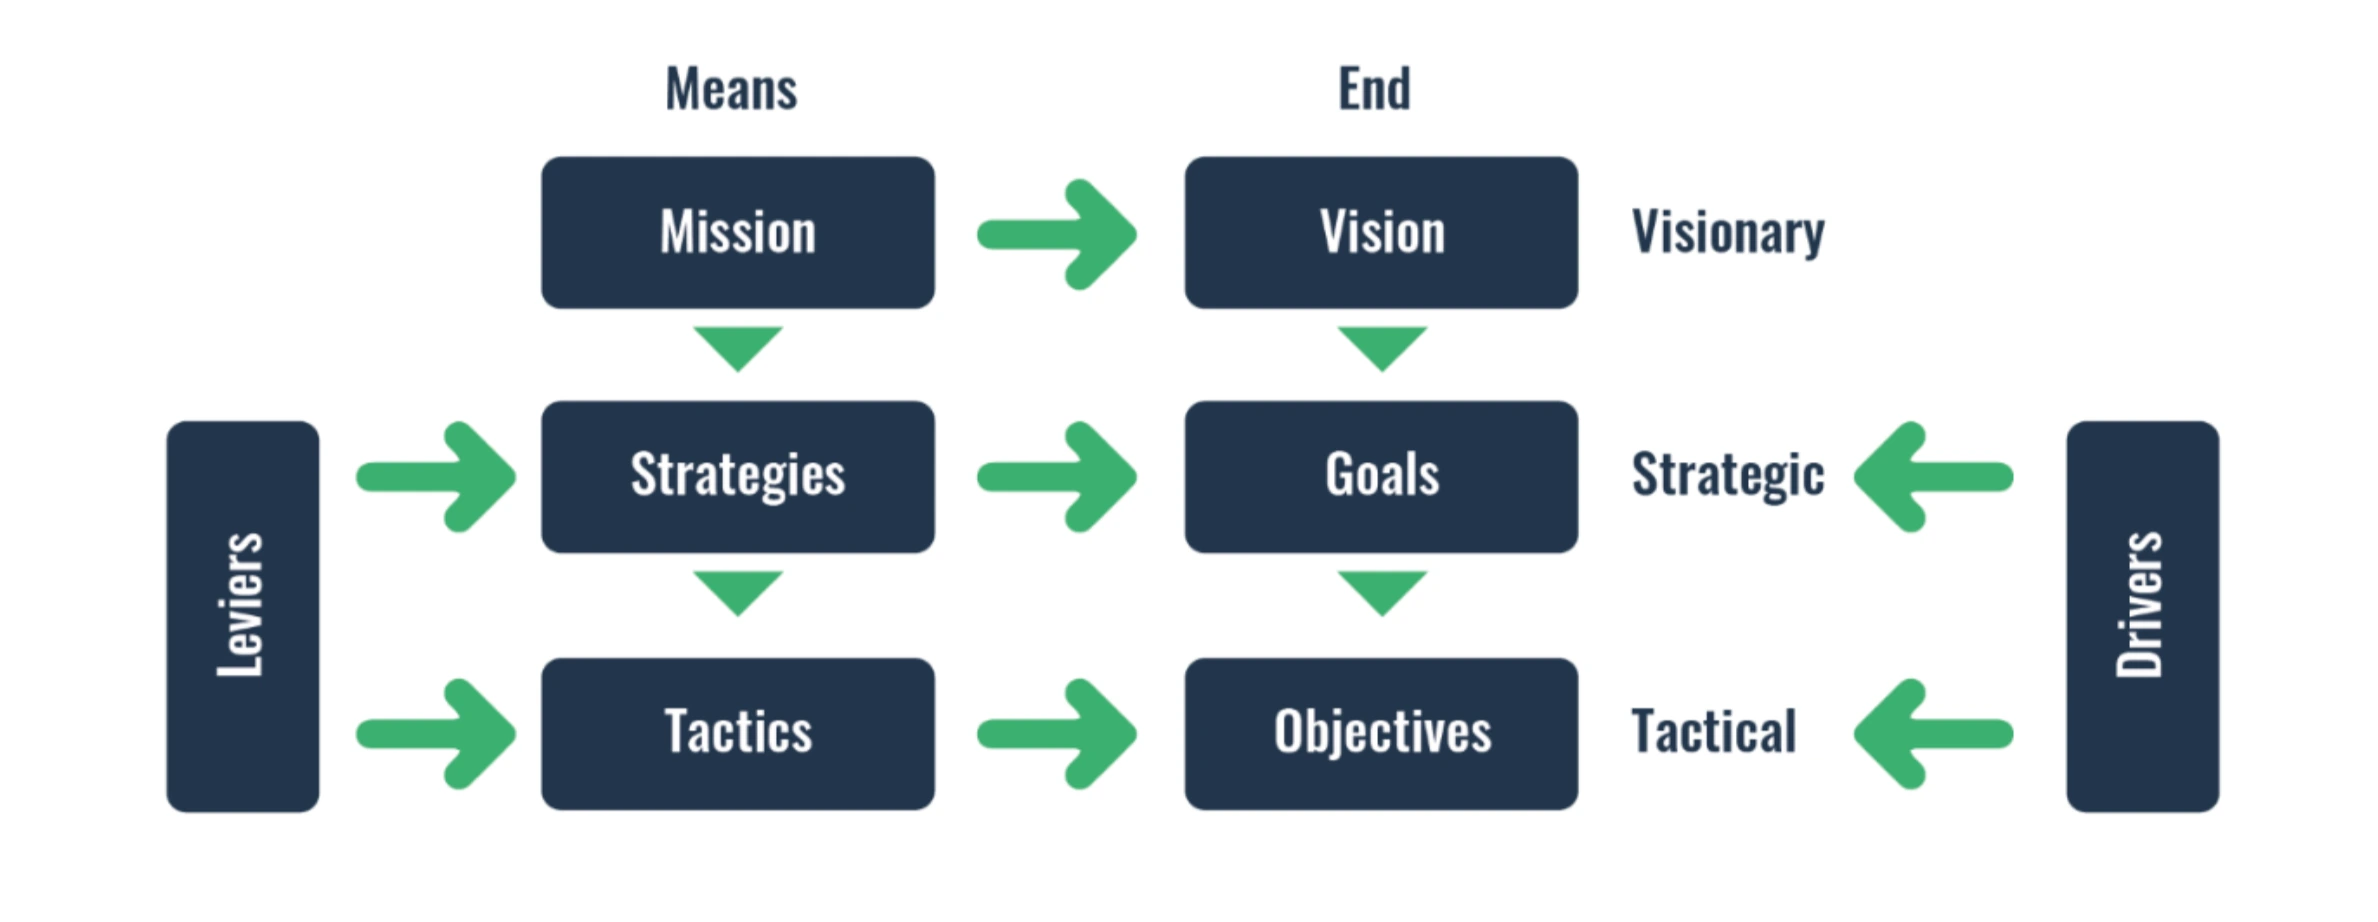
- Business Motivation Model (BMM): A diagram representing the enterprise strategy. It shows an organization's drivers, objectives, and goals and their influencing factors. It helps ensure the organization's activities align with its mission and vision.
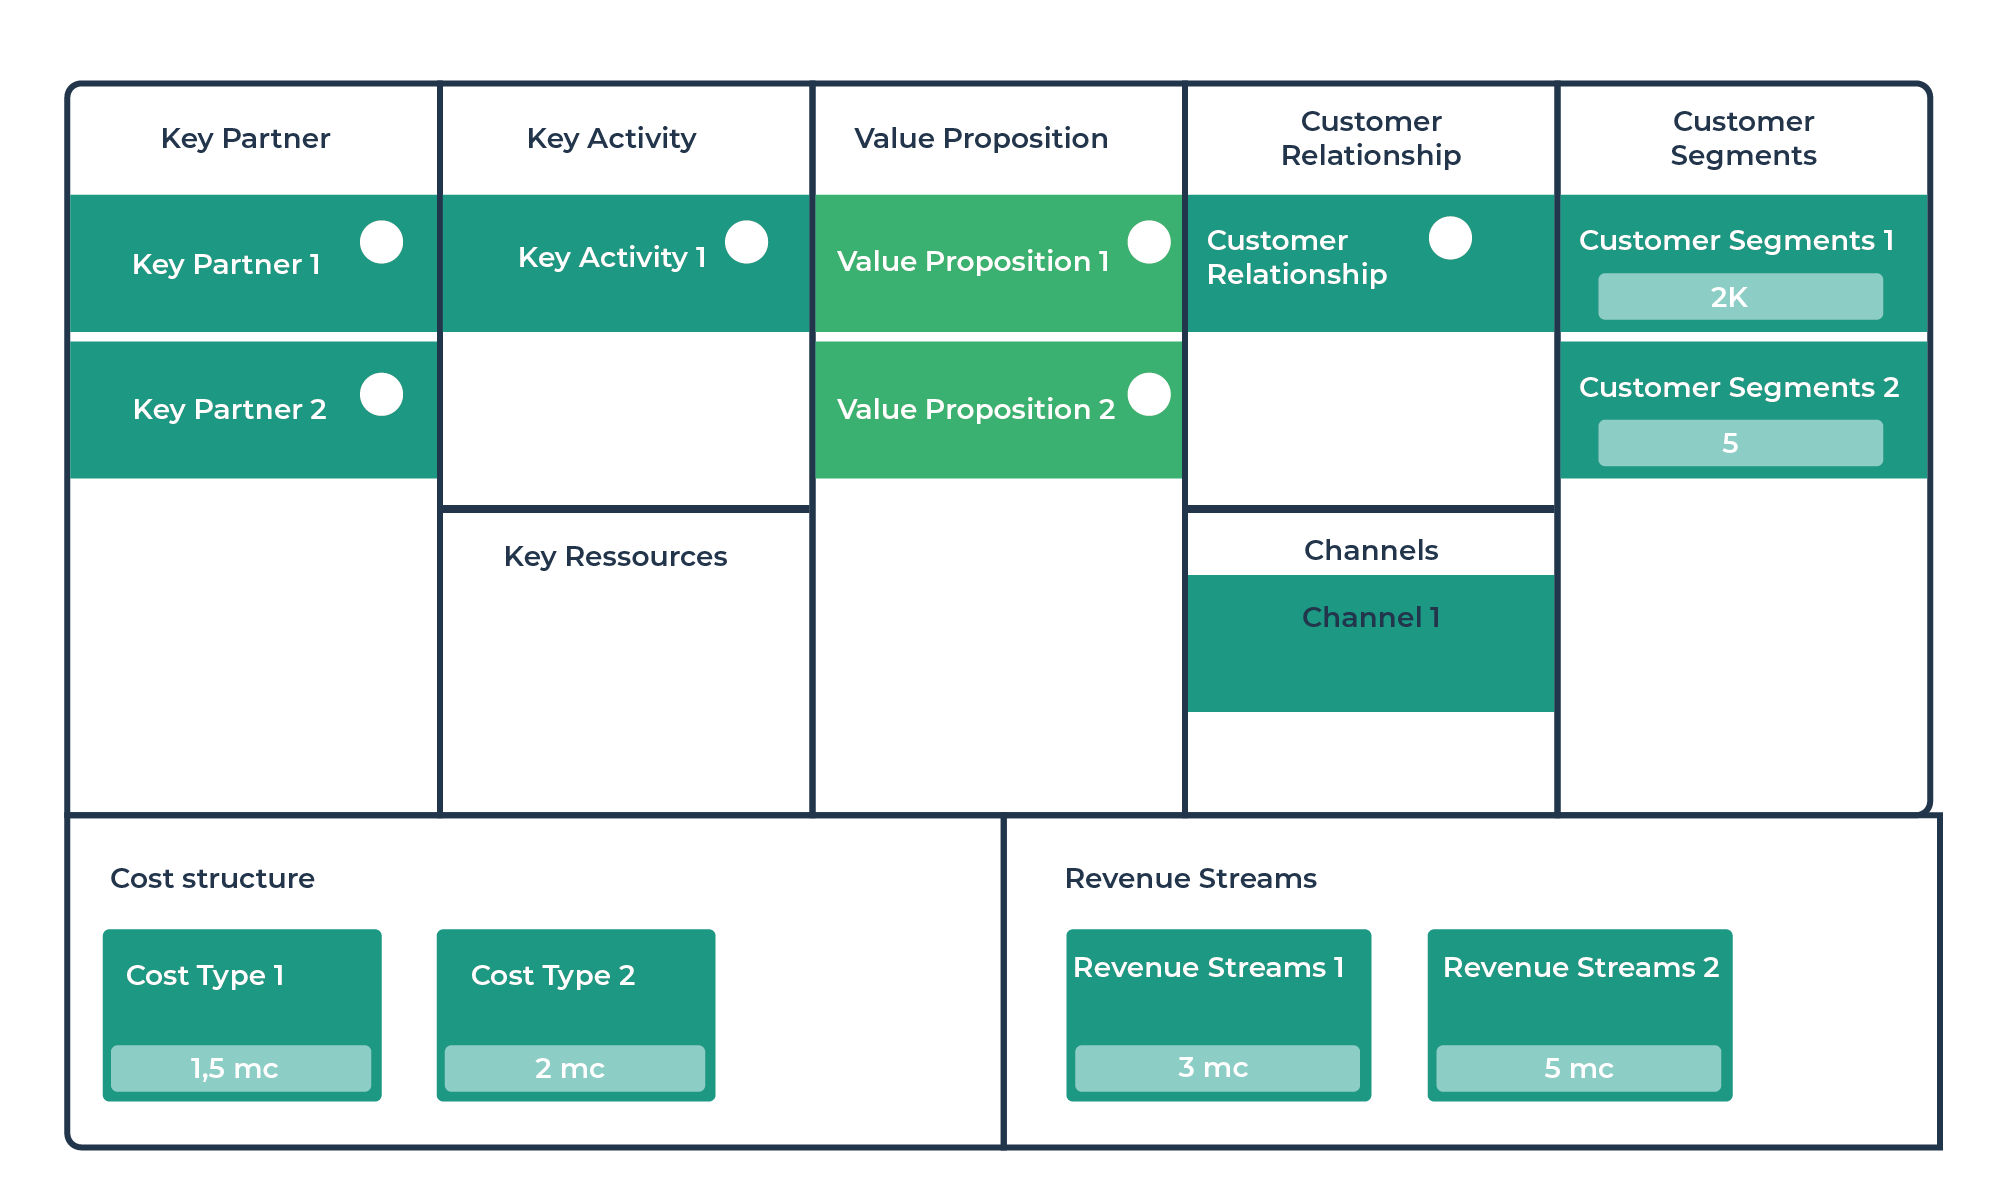
- Use the Business Model Canvas to get a high-level, comprehensive view of the strategic items required to bring a product to market successfully. Using the canvas, EA can identify opportunities to improve business processes, reduce costs, and enhance the customer experience.
- Business Capability Maps show the critical capabilities required by an organization to achieve its strategic goals. They help to identify gaps in the organization's capabilities and redundancies between IT systems and prioritize investments in resources and technology.
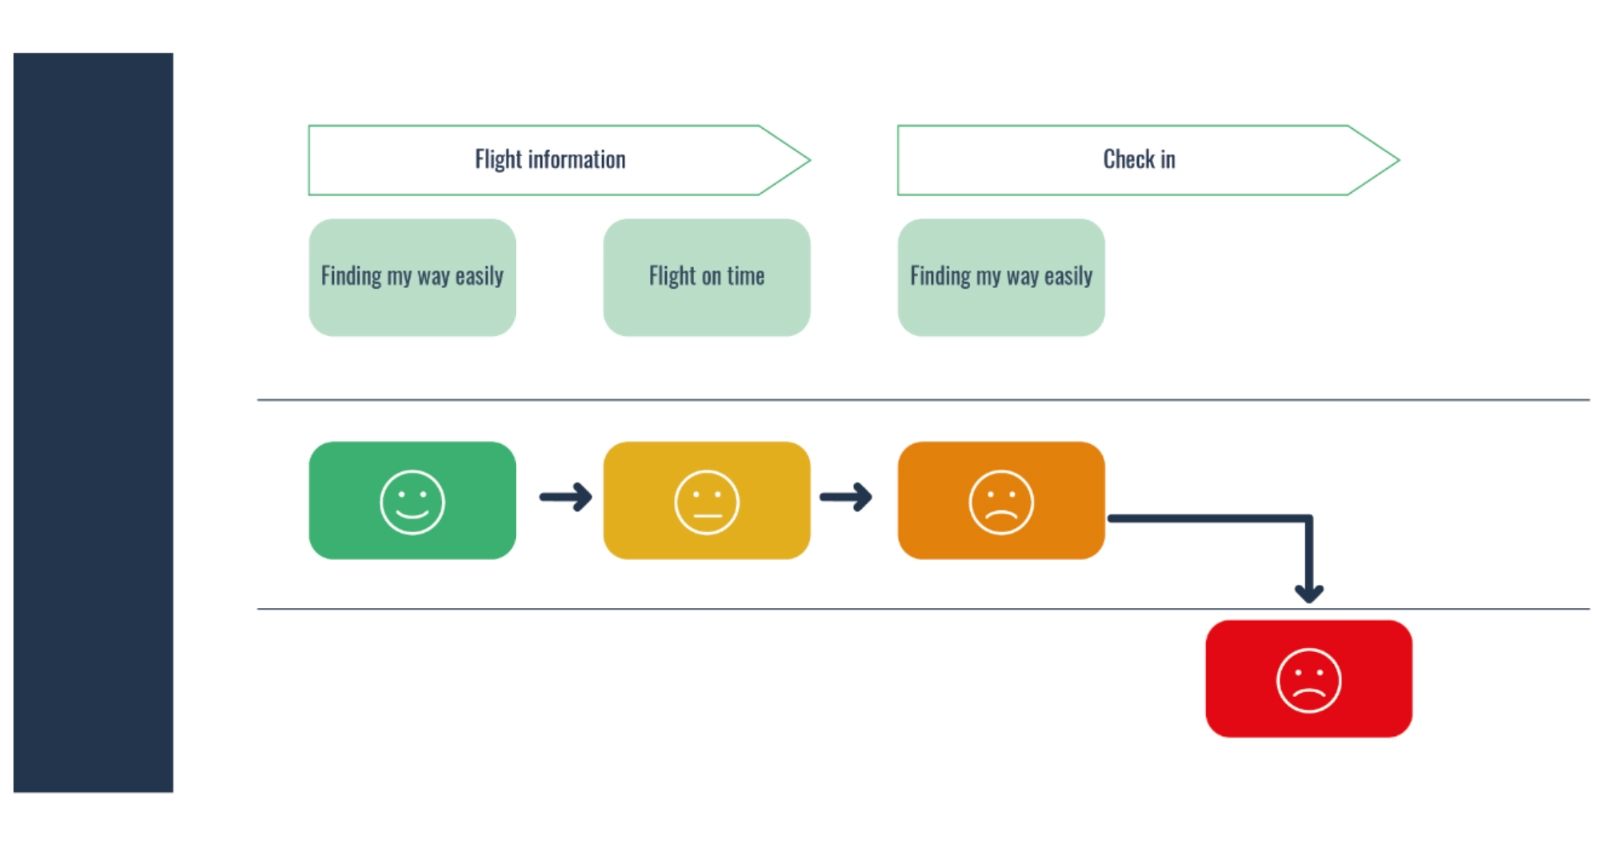
The BMM and Business Capability Maps are essential tools for Enterprise Architects in designing and aligning an organization's strategies, processes, and technology infrastructure with its overall goals and objectives. - Customer journey maps enable Enterprise Architects to understand how customers interact with the organization and their satisfaction level for each touchpoint.
- Process & value stream models show how products & services are delivered and analyze customer value. They help identify areas where processes can be streamlined, automated, or optimized.
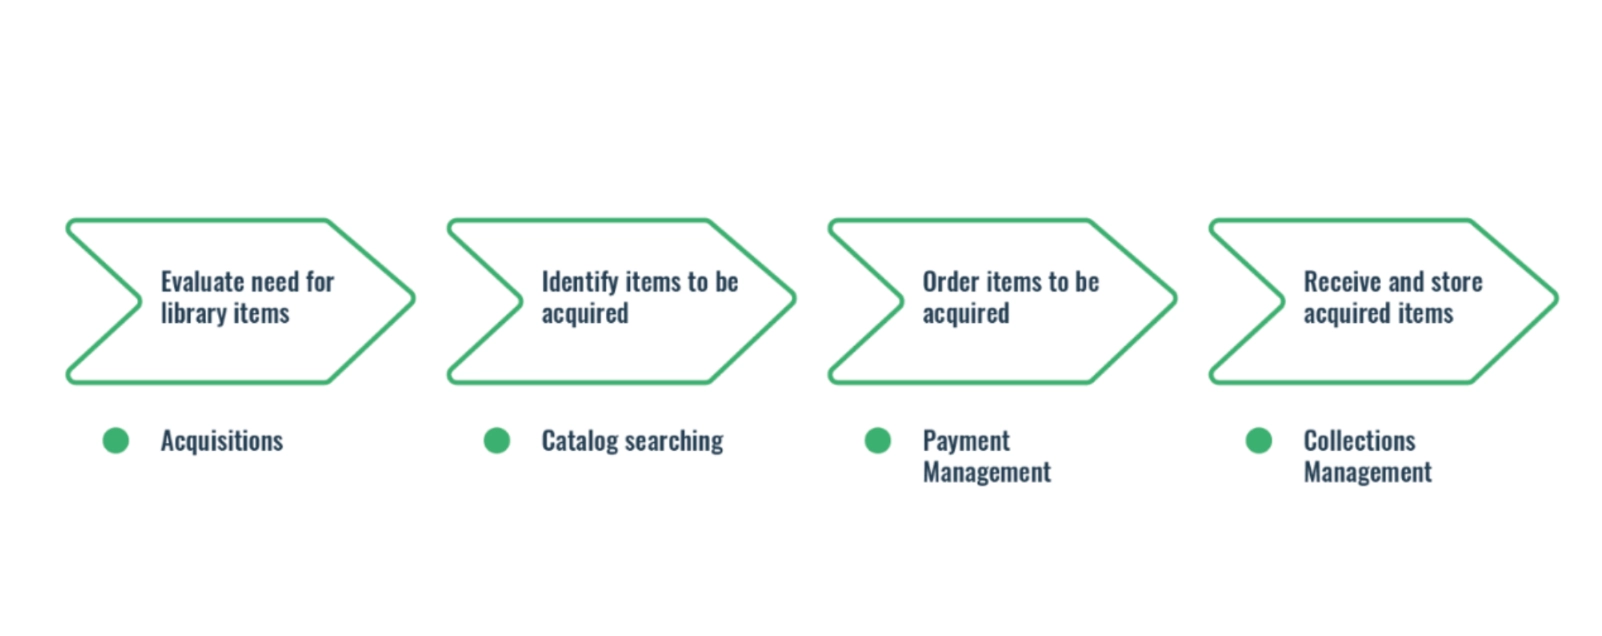
Process & customer journey mapping is necessary for IT modernization projects, which are an opportunity to improve customer satisfaction.
2. Information Architecture Diagrams:
These diagrams represent an organization's information assets and flow, including data entities and their relationships, flows, and stores.
- Business concept diagram: This diagram illustrates the relationships between concepts in a specific field. It visualizes the key concepts, ideas, or categories within a system or domain. Concept diagrams help organize complex information and clarify relationships between different concepts. They also aim to define a common vocabulary on a specific topic and are, therefore, used as a tool for communication, brainstorming, and analysis.
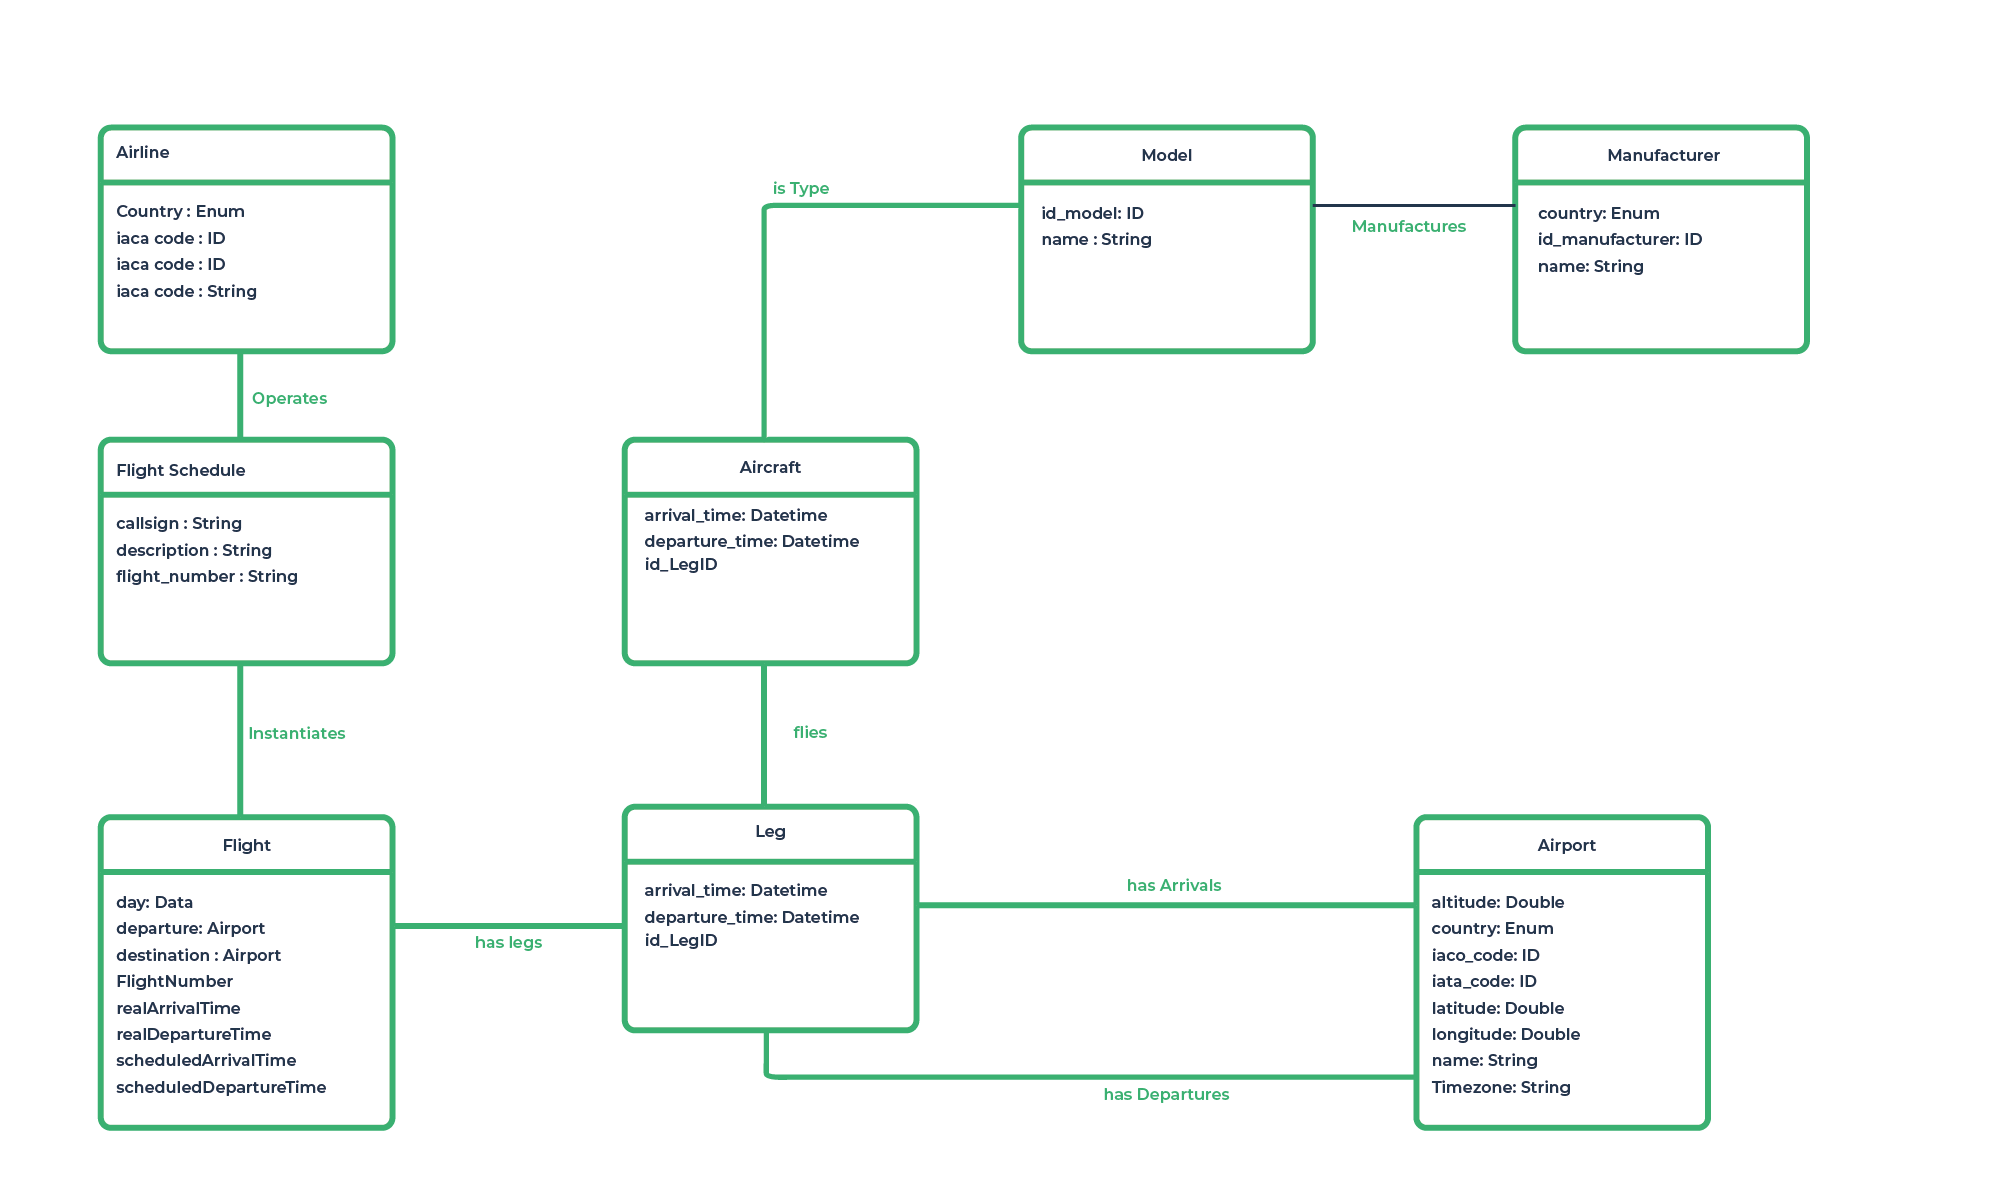
- Entity-relationship diagram: a model that provides a high-level view of the relationships between different entities in an information system or a database. They enable identifying the entities and relationships stored in the database and how they relate. Entity-relationship diagrams can also ensure the data is normalized and structured to minimize redundancy and improve data consistency.
3. Application Architecture Diagrams:
These diagrams represent the software applications and their relationships within an organization, including the application components, interfaces, and dependencies.
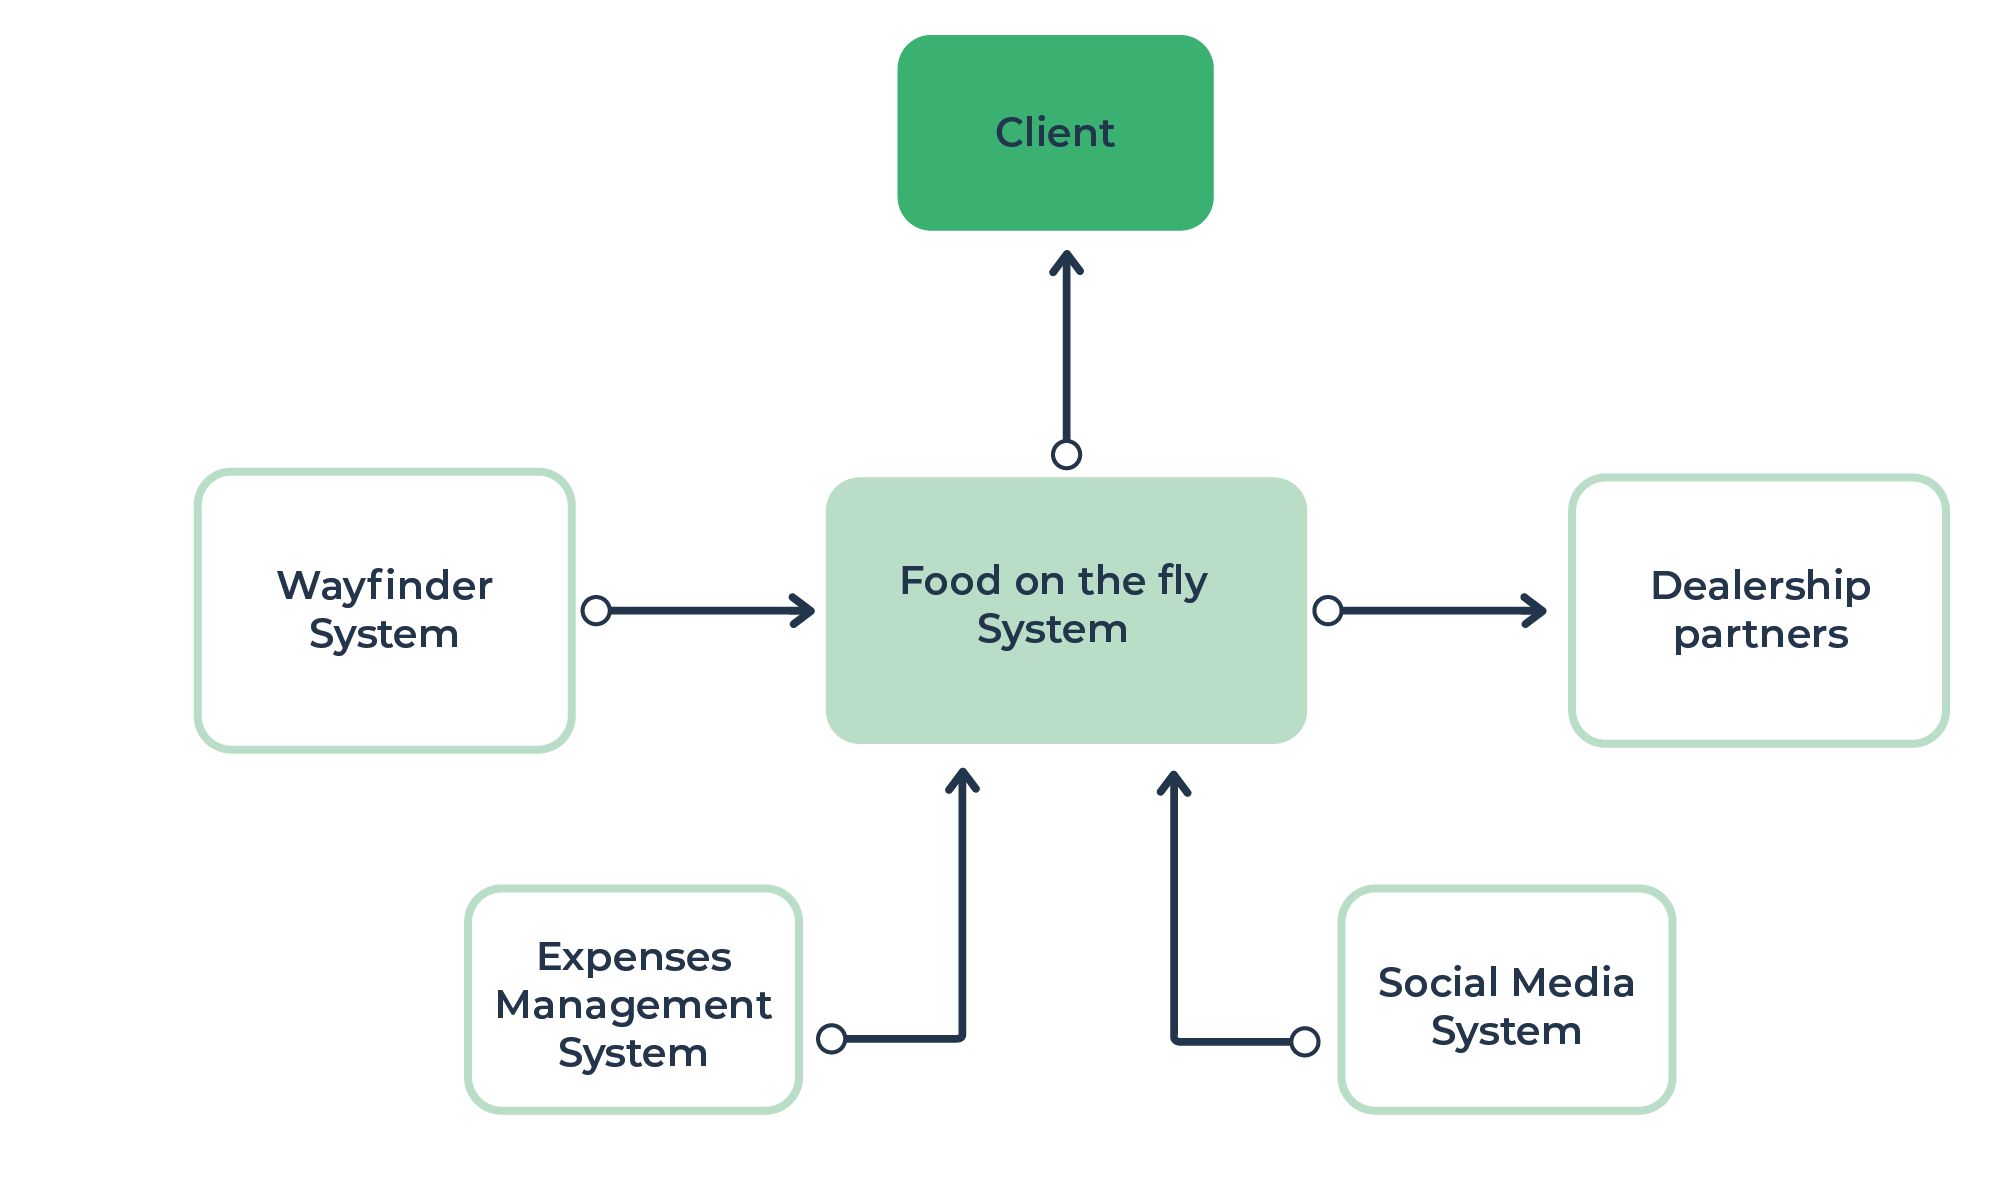
- Application environment model: This model helps the enterprise architect understand the environment in which an application or application system operates. It typically shows the application system and its interactions with other systems or people (internal and external). This model is critical to understanding the application's integration into the existing IT landscape and identifying change impacts.
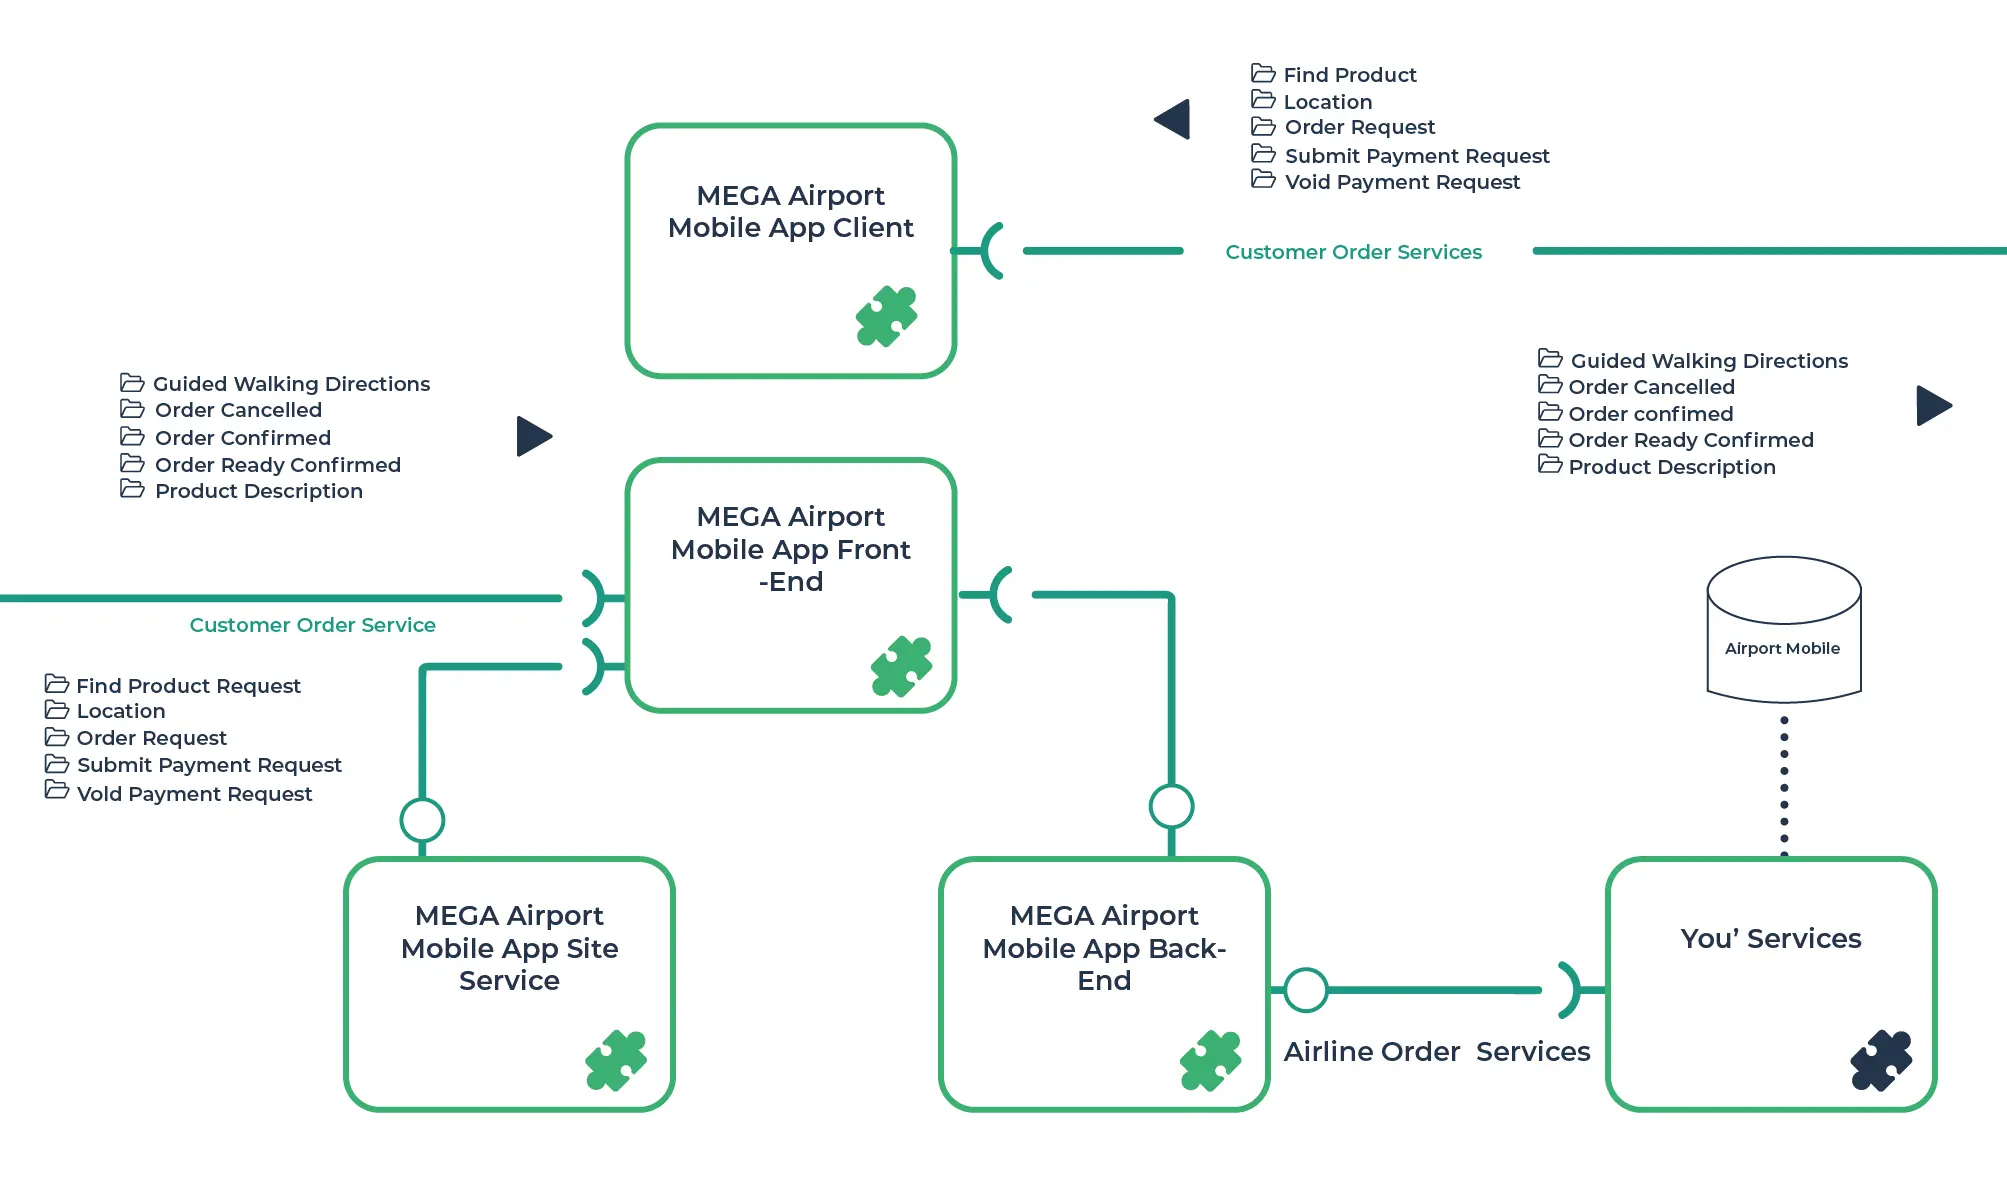
- Application data flow diagram: is a graphical representation of data flows within an application system, showing how data is processed, stored, and transmitted between the system components. It usually indicates application system components, data flows, data stores, and external entities interacting with the system. This model is essential to understanding and analyzing the system before its transformation.
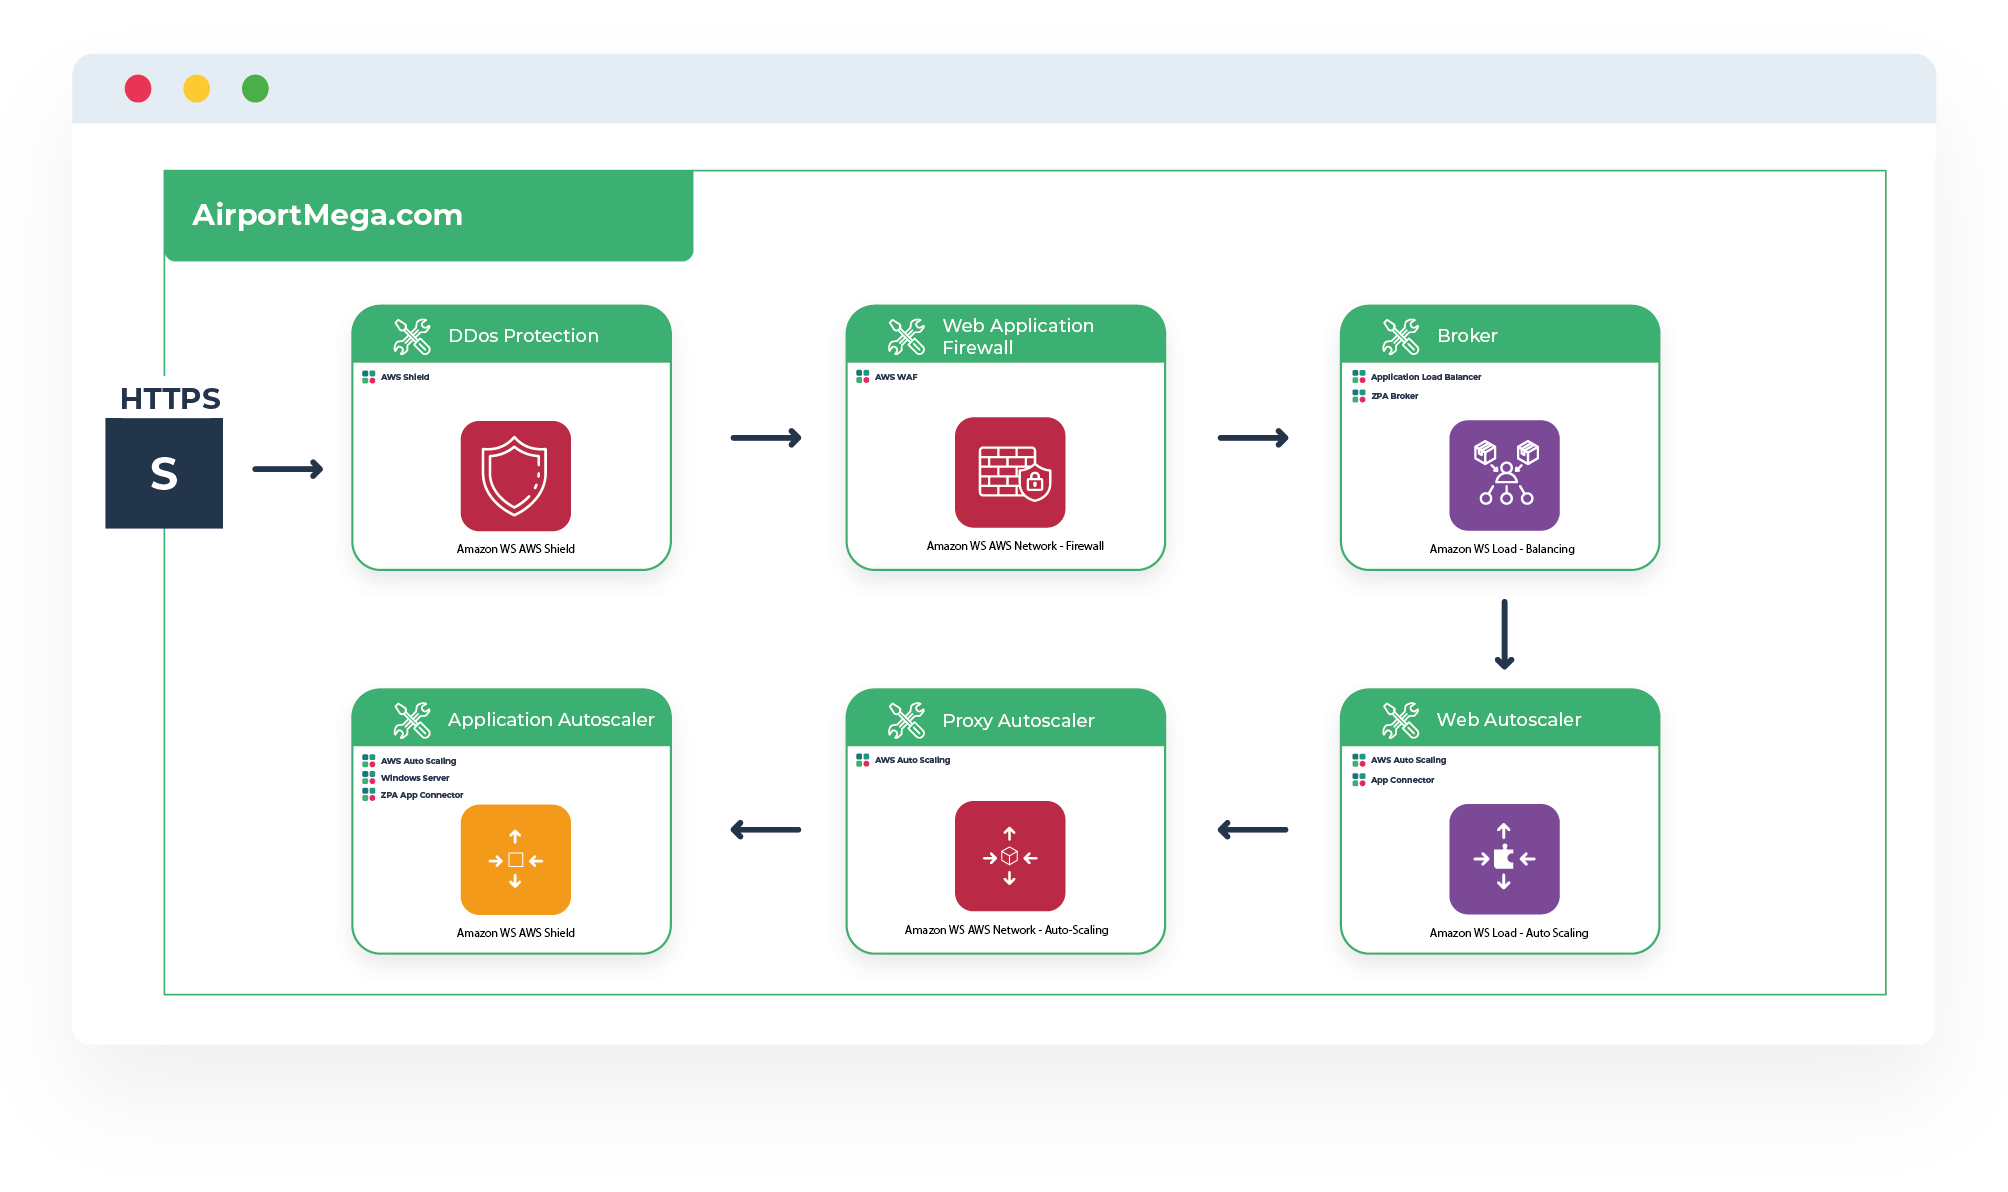
- Application deployment model: is a graphical representation of an application system's deployment across different hardware and software components. It is a tool used in enterprise architecture to understand and document the technical aspects of an application system, including its hardware infrastructure, operating systems, middleware, and other components.
- Application deployment model: helps architects identify potential scalability, availability, and performance issues. It helps design and implement robust and reliable application systems and identifies areas where improvements can be made to optimize hardware and software resources.
4. Technology Architecture Diagrams:
These diagrams represent the hardware and software infrastructure that supports an organization's IT systems, including the network components, servers, storage devices, and middleware.
- Technical infrastructure map: is a graphical representation of the hardware, software, and network infrastructure that supports an organization's IT systems. It is a tool used in enterprise architecture to document and analyze an organization's technical infrastructure, including hardware components, operating systems, databases, middleware, and networking components.

Each of these diagrams provides a different perspective on an organization's architecture, and together, they form a complete picture of the organization's structure, functions, and operations. Using these diagrams, enterprise architects can communicate complex architectural concepts to stakeholders, identify areas for improvement, and ensure that the organization's architecture is aligned with its goals and objectives.
Modeling diagrams with an EA tool
Modeling diagrams is essential to understanding a complex system such as an organization. However, starting from scratch may also be tedious and time-consuming.
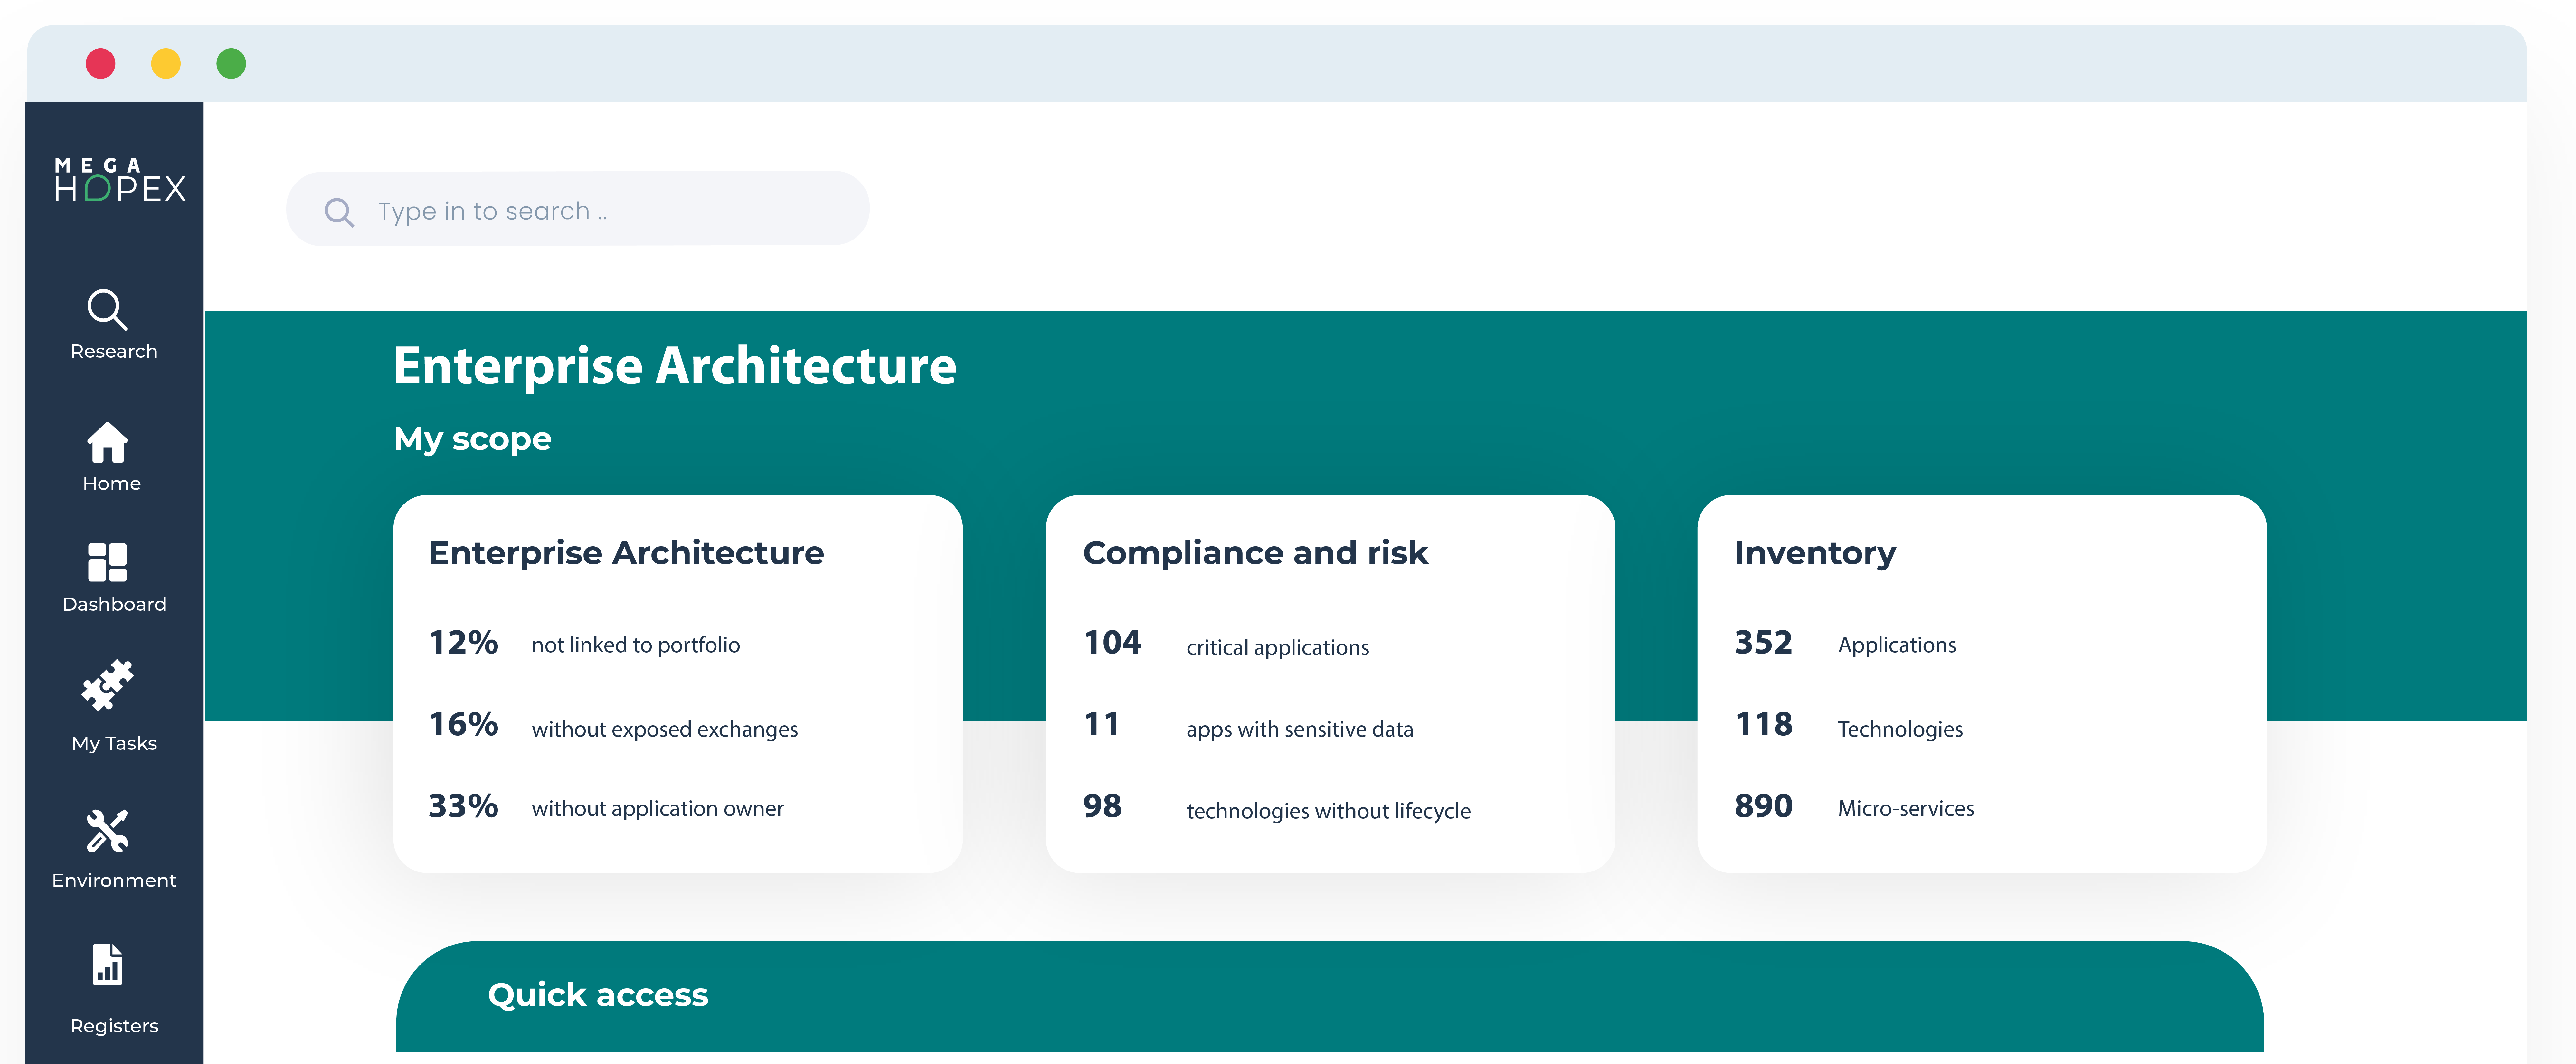
EA software solutions, such as MEGA HOPEX, provide methods, strong modeling capabilities, ready-to-use content, and automation features to describe high-level views of the organization's architecture, processes, services, and systems. These tools allow architects to quickly define and easily visualize the current state of their architecture and plan for future changes.
MEGA HOPEX Platform provides a set of EA diagrams that help organizations better understand their existing architecture and ensure that any proposed changes align with business objectives. EA models enable users to understand the relationships between different components, identify areas of complexity, and generate reports that, in turn, support business decisions.

Best Practices for Creating Effective Enterprise Architecture Diagrams
Following best practices while developing enterprise architecture diagrams is essential to ensure maximum effectiveness and benefits. These practices include identifying critical processes, understanding business and user requirements, creating a sound data architecture, and maintaining standardized notation and format. Other best practices also have the following:
- Starting small.
- Building on established frameworks and models.
- Focusing on business value.
- Continuously reviewing and updating architecture.
By following these steps, organizations can develop robust and scalable enterprise architecture diagrams that meet the rapidly changing business needs and provide significant value to the organization.
Benefits of Enterprise Architecture Diagrams for Your Business
EA diagrams provide several benefits to organizations, including:
Improved Communication
EA diagrams provide a common language and framework for communication across an organization. They help stakeholders understand how different organizational components fit together, making communication and collaboration easier.
Better Decision-Making
EA diagrams provide a clear understanding of an organization's architecture, making it easier to make informed decisions. By visually representing the organization's architecture, EA diagrams help stakeholders identify opportunities for improvement and optimize processes.
Enhanced Strategic Planning
EA diagrams help organizations align their processes and systems with their strategic goals. By providing a comprehensive view of an organization's architecture, EA diagrams help stakeholders identify areas for improvement and plan for the future.
Increased Efficiency
EA diagrams help organizations identify redundancies and inefficiencies in their processes and systems. Organizations can reduce costs, increase productivity, and improve performance by optimizing these processes and systems.
Challenges of Enterprise Architecture Diagrams
Despite their benefits, EA diagrams can present several challenges, including:
Complexity
EA diagrams can be complex and challenging to understand, especially for stakeholders unfamiliar with the organization's architecture.
Maintaining Accuracy
EA diagrams must be updated regularly to reflect the organization's architecture accurately. This can be challenging, especially for large and complex organizations.
Resistance to Change
EA diagrams can sometimes highlight areas for improvement that require significant changes to processes and systems. This can lead to resistance from stakeholders comfortable with the status quo.
Future of Enterprise Architecture Diagrams
As organizations evolve and become more complex, using EA diagrams will become increasingly important. Advances in technology, such as artificial intelligence and machine learning, will also influence the future of EA diagrams.

Summary
Enterprise architecture diagrams provide a powerful tool for companies of all sizes to help visualize the overall structure of their business operations.
Through this diagram, businesses can better understand the complexity of their systems and processes, allowing them to identify opportunities for improvement. Enterprise architecture diagrams also provide insights into how various departments are connected, enabling companies to optimize collaboration between departments and achieve all objectives. EA software solutions support Enterprise Architecture practices by providing robust features to ease and accelerate the modeling of EA diagrams.
FAQs
Enterprise Architecture Diagram is a graphical representation of an organization's current and future IT architecture. It illustrates the structure, systems, components, and interactions of all the elements that make up an enterprise's IT environment.
Drawing an enterprise architecture diagram can be a complex process, but I can provide you with some general steps to get started:
- Identify the purpose and scope of your diagram. Before drawing your diagram, you must determine what it will be used for and the scope of the information you want to include. This will help you determine which elements to include and how to organize them.
- Determine the framework or notation to use. Several frameworks and notations can be used to create an enterprise architecture diagram, such as TOGAF, ArchiMate, and UML. Choose the one that best fits your needs and experience level.
- Identify the elements to include. Enterprise architecture diagrams can include many elements, such as business processes, applications, data, infrastructure, and stakeholders. Identify which elements are relevant to your purpose and scope and start organizing them.
- Determine the relationships between the elements. Once you have identified the items to include, you must determine how they relate. This can involve identifying dependencies, flows of information or resources, and interactions between stakeholders.
- Start drawing your diagram. Organize your elements and relationships into a clear and concise diagram using your chosen framework or notation. You may need to iterate and revise your model based on stakeholder feedback or new information.
- Validate your diagram. Once your model is complete, validate it against your purpose and scope, and ensure it accurately reflects your organization's architecture. You may also want to get feedback from stakeholders to ensure that it meets their needs.
Overall, drawing an enterprise architecture diagram requires careful planning, attention to detail, and an understanding of the elements and relationships that make up your organization's architecture.


Increase visibility and rationalize your IT portfolio with APM
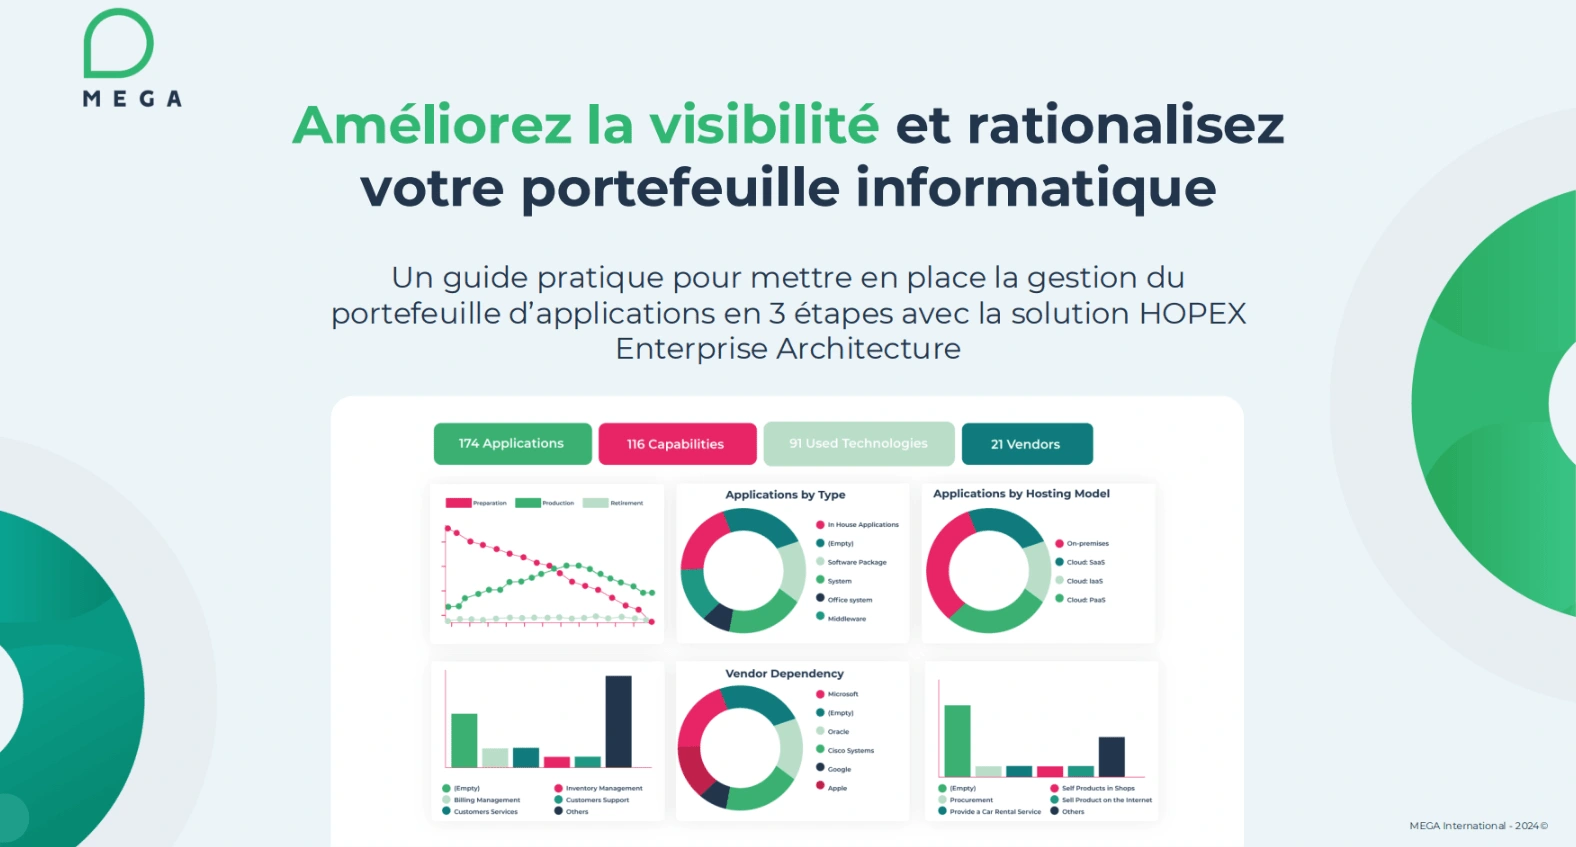
Get an effective methodology to set up and achieve a successful application rationalization initiative.
Enterprise Architecture Related Content
Shift from a documentation tool to an operational tool and accelerate business transformation


MEGA HOPEX for Enterprise Architecture
Request a demonstration of HOPEX for EA, and see how you can have immediate value of your projects.