Technical Architecture Diagrams: Examples, Types, and Best Practices

Technical architecture diagrams are vital tools for developers and architects involved in software development and system design. These diagrams provide a system or application's architecture, components, and data flow. Here, we will delve into the definition, importance, types, creation, and benefits of technical architecture diagrams and their role in software development and system design.
What is a Technical Architecture Diagram?
A technical architecture diagram, also known as an architectural diagram, depicts the structure and design of a software system or application. It illustrates the system's architecture, components, and data flow, providing an overview of the interactions between the different elements.
A technical architecture diagram provides a detailed software architecture visualization, outlining the various components and their relationships. It is a valuable reference for developers and architects, offering insights into the system's design and data flows.
Importance of Technical Architecture Diagrams
Technical architecture diagrams are essential for communicating the system's design and functionality to stakeholders. They help stakeholders, including developers, architects, and business leaders, to understand the system's structure and how different components integrate and interact. Consequently, technical architecture diagrams facilitate impact analysis and informed decision-making and enhance collaboration among project stakeholders.
Components of Technical Architecture Diagrams
Technical Architecture Diagrams typically include the following components:
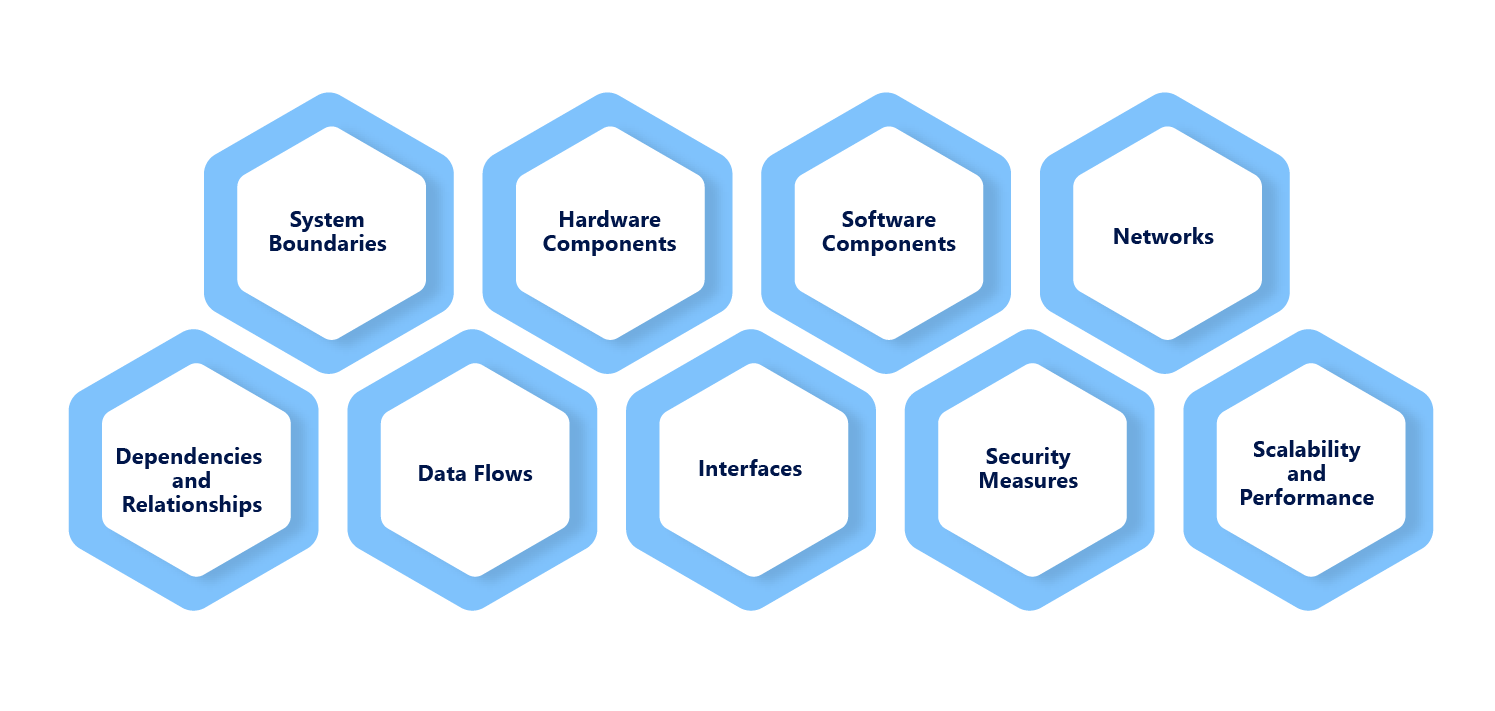
- System Boundaries: This defines the scope of the system or solution depicted in the diagram.
- Hardware Components: These include servers, computers, routers, switches, storage devices, and other physical infrastructure elements.
- Software Components: These represent the various software applications, modules, databases, and operating systems that make up the system.
- Networks: This component shows the communication channels and protocols used to connect the system's different hardware and software components.
- Data Flows: Indicate data movement between components and systems, illustrating how information flows through the architecture.
- Interfaces: Represent the interaction points between different components or systems, showing how they exchange data or services.
- Security Measures: This includes components such as firewalls, encryption mechanisms, access controls, and other security measures implemented within the architecture.
- Scalability and Performance: This component depicts how the system can handle increased workloads and ensure optimal performance.
- Dependencies and Relationships: This component illustrates the dependencies and relationships between various components, highlighting interdependencies or reliance on external systems or services.
Collectively, these components provide a comprehensive technical architecture overview, helping stakeholders understand the system's structure, interactions, and dependencies.
Types of Architectural Diagrams
Several architectural diagrams are utilized in software development and system design, each serving specific purposes and conveying distinct information. Understanding the various types of architectural diagrams is crucial for effectively representing the architecture and design of a system.
These diagrams are crucial in the field of software engineering and IT system design for several reasons:
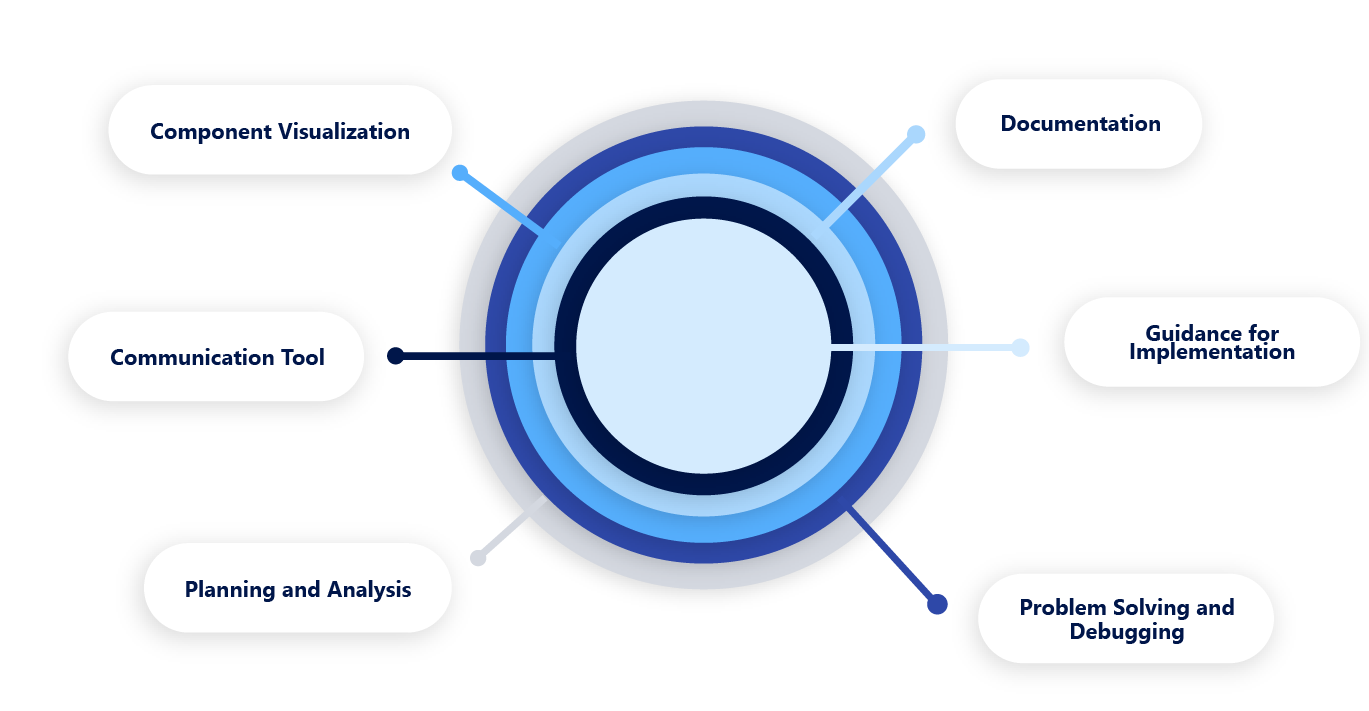
- Component Visualization provides a clear picture of a system's various components, such as hardware, software, databases, and networks, and how they interconnect.
- Communication Tool: They serve as an effective communication tool among various stakeholders, including developers, project managers, and clients, ensuring everyone has a shared understanding of the system's design.
- Planning and Analysis: These diagrams help in planning and analyzing the system architecture, identifying potential issues, dependencies, and areas for optimization.
- Documentation: They are part of the system's documentation, providing a reference for current and future development and maintenance efforts.
- Guidance for Implementation: Technical architecture diagrams guide developers and engineers during the implementation phase, ensuring the system is built according to the planned design.
- Problem-Solving and Debugging: They are helpful in problem-solving and debugging, helping identify where issues may quickly arise within the system.
Common types of technical architecture diagrams include:
- System Architecture Diagram: This shows the high-level structure of the system as a whole.
- Network Diagram: Focuses on the network structure and interactions within the system.
- Component Diagram: Details the software components and their relationships.
- Deployment Diagram: Illustrates how software is deployed on the hardware.
- Sequence Diagram: Represents the interaction between different components over time.
Each type of diagram serves a different purpose and offers a unique perspective on the system, contributing to a comprehensive understanding of its architecture.
Effective Technical Architecture Diagrams
Designing practical technical architecture diagrams is critical to software and system development. It requires a careful balance between detail and clarity. Here are some guidelines, considerations, tools, collaborative approaches, and common pitfalls to be aware of:
How to Design Effective Technical Architecture Diagrams
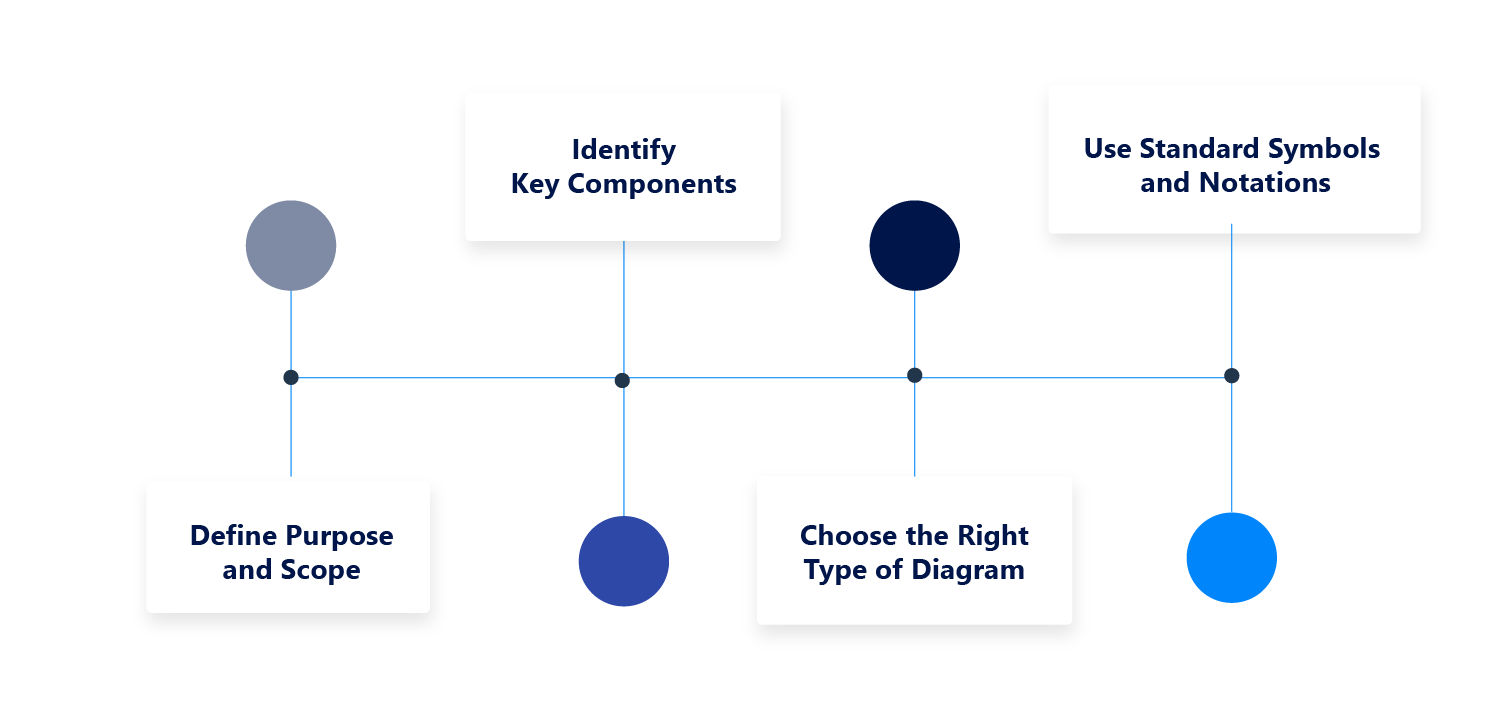
- Define Purpose and Scope: Define what you want to communicate with the diagram. Is it for high-level overviews or detailed technical insights?
- Choose the Right Type of Diagram: Depending on your needs, select the appropriate type of diagram (e.g., deployment, component, sequence diagram).
- Identify Key Components: Determine the main components of your system - such as databases, servers, and applications - and how they interact.
- Use Standard Symbols and Notations: Stick to widely recognized symbols and notation systems like UML (Unified Modeling Language), which enhances understanding and consistency.
Considerations for Designing Technical Architecture Diagrams
- Audience Understanding: Tailor the complexity and technicality of the diagram to the audience's knowledge level.
- Clarity and Simplicity: Strive for simplicity to enhance clarity. A cluttered diagram can be confusing.
- Accuracy and Detail: Ensure the diagram accurately reflects the system and provides the necessary level of detail.
- Scalability and Flexibility: Consider how the system might evolve and how this could be represented in future iterations of the diagram.
Tools and Software for Creating Technical Architecture Diagrams
- Microsoft Visio: Widely used for various types of technical diagrams.
- Lucidchart: A cloud-based tool offering collaboration features.
- Draw.io (now diagrams.net): A free, open-source diagramming tool.
- ArchiMate: Specialized in enterprise architecture diagrams.
- AutoCAD: For more complex and detailed architectural needs.
- HOPEX Enterprise Architecture: provides strong modeling capabilities and comprehensive coverage of technical architecture diagrams, combined with a single repository to deliver powerful analytics and facilitate informed decision-making.
Collaborative Approaches in Creating Technical Architecture Diagrams
- Workshops and Brainstorming Sessions: Involve different stakeholders in sessions to gather diverse perspectives.
- Iterative Reviews: Regularly review and update diagrams with input from various team members.
- Shared Online Platforms: Use cloud-based tools for real-time collaboration and version control.
Common Mistakes to Avoid in Technical Architecture Diagram Design
- Over-Complication: Adding too much detail that overwhelms the viewer.
- Out-of-Date Information: Failing to update the diagram as the system evolves.
Inconsistency in Symbols and Notations: Using multiple styles or non-standard symbols that confuse. - Ignoring the Audience's Perspective: Not aligning the diagram's complexity with the audience's technical understanding.
Communication Through Technical Architecture Diagrams
- Explicit Annotations: Provide clear labels and explanations where necessary.
- Use of Legends and Keys: Include a legend or key if using specific symbols or color codes.
- Interactive Elements: Use interactive elements like clickable sections for more details in digital formatsCreating.
- Regular Updates and Presentations: Keep the diagrams up-to-date and present them regularly to relevant stakeholders to ensure ongoing clarity and alignment.
| Creating practical technical architecture diagrams involves a combination of precise planning, understanding the audience, choosing the right tools, collaborative development, and avoiding common pitfalls. These diagrams are not just tools for technical teams, but also powerful communication aids that can bridge the gap between technical and non-technical stakeholders. |
Software Architecture Patterns and Diagrams
Software architecture patterns form the blueprint for organizing and structuring software systems, guiding the design and implementation of software applications. Software architecture diagrams often represent these patterns in designing and implementing these systems and visually articulate the system's design and structural elements.
Overview of Software Architecture Patterns
Software architecture patterns, such as layered architecture, microservices architecture, and event-driven architecture, provide standard templates for designing software systems and offer proven solutions to recurring design problems and challenges.
Role of Architectural Patterns in Software Development
Architectural patterns are reusable design solutions that address common design concerns, promoting consistency, modularity, and scalability in software development projects. By incorporating these patterns, developers can expedite the design and implementation of software systems.
Using Software Architecture Diagrams in Designing Applications
Software architecture diagrams help visualize the application'said in designing and implementing these systems and architecture, depicting the structural components, communication pathways, and data flows. These diagrams provide developers with a clear understanding of the application's design and facilitate efficient collaboration among development teams.
Examples of Technical Architecture Diagrams in Real-world Applications
Technical architecture diagrams find their applications in various real-world scenarios, each tailored to illustrate specific system architecture and design aspects. Here are some examples where these diagrams play a crucial role:
E-Commerce Platforms: Diagrams in e-commerce systems depict the architecture of online shopping platforms, illustrating components like user interfaces, payment gateways, inventory management systems, recommendation engines, and their interactions with databases and third-party services.
Cloud Infrastructure: For cloud-based applications, diagrams show how different services (like compute instances, storage services, and databases) are configured and interact in cloud environments. They also illustrate using load balancers, network configurations, and security protocols.
Enterprise IT Systems: In larger organizations, diagrams illustrate the relationships between various business applications, databases, and middleware systems. They might show how data flows between customer relationship management (CRM) systems, enterprise resource planning (ERP) software, and business intelligence tools.
Mobile Application Architecture: These diagrams display the structure of mobile apps, detailing components like user interface, local storage, API integrations, and how the app interacts with back-end servers and external services.
Network Infrastructure: Network diagrams for IT infrastructure show how devices like routers, switches, firewalls, and servers are interconnected. They are essential for planning network installations and troubleshooting network issues.
Internet of Things (IoT) Systems: Diagrams in IoT projects illustrate how various sensors, actuators, and other devices are connected and interact with central processing units and cloud services. They often include data flow and management aspects.
Cybersecurity Architecture: These diagrams detail the security layers and measures to protect an IT system, showing firewalls, intrusion detection systems, data encryption, and secure communication channels.
Software as a Service (SaaS) Solutions: SaaS architecture diagrams depict how the multi-tenant architecture is set up, including user authentication, data storage, service layers, and how these interact with the client applications.
Healthcare Information Systems: In healthcare, diagrams illustrate how patient data flows between electronic health records (EHR), diagnostic tools, and administrative systems, ensuring compliance with healthcare standards and privacy laws.
Banking and Financial Systems: These diagrams show the architecture of banking software systems, including transaction processing, risk management, compliance monitoring, and integrating various financial services.
| These examples demonstrate how technical architecture diagrams are tailored to specific industries and applications, providing essential insights into the system's structure and workings. They not only aid in designing and implementing these systems but also play a crucial role in ongoing maintenance and optimization efforts. Aid in designing and implementing these systems and |
Benefits of High-Level Technical Architecture Diagrams
High-level technical architecture diagrams offer a simplified yet comprehensive representation of system architecture, providing numerous benefits for communication, understanding, and implementation of software systems. Some of the key benefits include:
- Visual Representation: Diagrams visually represent the system's architecture, making it easier for stakeholders to understand and communicate complex technical concepts. Visualizing the architecture helps identify relationships, dependencies, and potential design issues.
- Communication and Collaboration: Architectural diagrams serve as a common language for communication between technical and non-technical stakeholders. They facilitate practical discussions, decision-making, and collaboration among team members, architects, developers, and business stakeholders.
- System Understanding: Diagrams help stakeholders better understand the system's structure, components, and interactions. They provide a clear overview of how the system works, enabling stakeholders to identify potential bottlenecks, performance issues, or areas for improvement.
- Design Validation and Documentation: Diagrams act as tools for validating design decisions and documenting architectural choices made during the development process. They capture essential design principles, patterns, and relationships, helping to maintain a record of the system's architecture.
- Change Management: Architectural diagrams assist in managing system changes. They provide a visual baseline to evaluate the impact of proposed changes or enhancements. Diagrams help understand how modifications in one component may affect others, aiding in effective change management.
- Onboarding and Training: Diagrams help onboard new team members and facilitate their understanding of the system's architecture. They also serve as a training resource, enabling newcomers to grasp the system's structure, components, and interactions quickly.
- Risk Identification: Architectural diagrams help identify potential risks and vulnerabilities within the system. By visualizing the architecture, stakeholders can assess security, performance, and scalability risks and develop strategies to address them.
- Scalability and Performance Analysis: Diagrams assist in analyzing the system's scalability and performance. They provide insights into how different components interact and how data flows within the architecture, enabling stakeholders to identify potential bottlenecks or areas for optimization.
Overall, technical architecture diagrams facilitate effective communication, understanding, documentation, and decision-making throughout the software development lifecycle.
Challenges in Creating Technical Architecture Diagrams
Creating technical architecture diagrams comes with challenges that can impact their effectiveness and accuracy. These challenges are crucial to address for anyone involved in developing and utilizing these diagrams. Here's an overview of some common challenges:
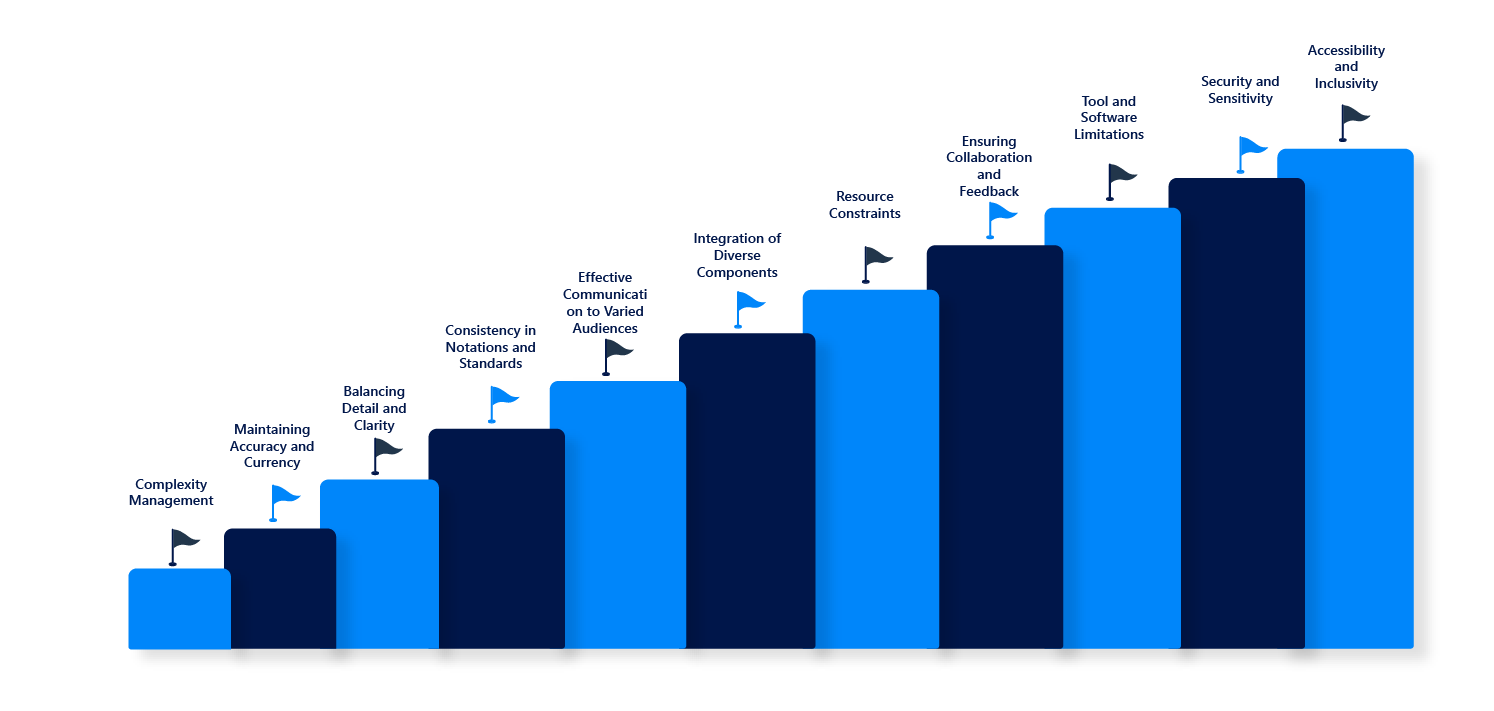
- Complexity Management: Technical architectures can be incredibly complex, especially in large systems or organizations. Capturing this complexity in a diagram without making it overwhelming or confusing is a significant challenge.
- Maintaining Accuracy and Currency: Updating the diagrams with the latest changes can be difficult as systems evolve. Outdated diagrams can lead to better decision-making.
- Balancing Detail and Clarity: Finding the right balance between providing enough detail to be helpful and keeping the diagram clear and understandable is often challenging. Too much detail can clutter the diagram, while too little can render it useless.
- Consistency in Notations and Standards: For clarity, consistent notations and standards across all organizational diagrams are crucial. However, this can be challenging, especially in environments where different teams or departments may have their preferences.
- Effective Communication to Varied Audiences: Tailoring the diagram to suit different audiences – from technical experts to business stakeholders – requires a deep understanding of what each audience needs to know and how they will likely interpret the information.
- Integration of Diverse Components: Modern systems often involve cloud services, legacy systems, third-party services, and various technologies. Representing how these diverse components interact within a single architecture diagram can be complex.
- Resource Constraints: Time and resources allocated for creating and maintaining these diagrams might be limited, especially in fast-paced development environments or smaller organizations.
- Ensuring Collaboration and Feedback: Facilitating collaboration among various stakeholders and incorporating their feedback into the architecture diagram can be challenging, particularly in large or distributed teams.
- Tool and Software Limitations: Sometimes, the available tools and software may not have the required features or flexibility to represent the architecture effectively, or there might be a learning curve associated with these tools.
- Security and Sensitivity: Diagrams often contain sensitive information about the system's design, which could pose security risks if not handled appropriately.
- Accessibility and Inclusivity: Ensuring that diagrams are accessible to all, including people with disabilities, and accommodating various levels of technical expertise.
To overcome these challenges, it is essential to approach them with a thoughtful strategy. This involves meticulous planning, considering the diverse requirements of various stakeholders. The diagrams should be updated regularly to align with the evolving nature of technical architectures.
Best Practices for Implementing Technical Architecture Diagrams
Implementing technical architecture diagrams effectively ensures they serve their intended purpose in system design, communication, and documentation. Here are some best practices to consider:
- Define Clear Objectives: Before creating a diagram, clarify its purpose. Is it to illustrate the overall system layout, detail a specific process, or communicate infrastructure to stakeholders? This clarity will guide the level of detail and focus of the diagram.
- Understand Your Audience: Tailor the complexity and style of the diagram to your audience. Diagrams for technical teams can include more detailed technical information. In contrast, those for business stakeholders might need to be more high-level and focused on how the system supports business processes.
- Use Standard Notations and Symbols: Stick to widely recognized symbols and notations, like UML (Unified Modeling Language), to maintain consistency and ensure that the diagrams are easily understandable by others familiar with these standards.
Keep It Simple and Clear: Avoid clutter. Only include elements that add value and help achieve the diagram's objective. If necessary, a complicated diagram can be broken down into smaller, more focused diagrams. - Regular Updates: Update the diagrams regularly to reflect changes as systems evolve. Outdated diagrams can help people understand and make correct decisions.
Document and Annotate: Provide sufficient documentation and annotations within the diagram. This might include descriptions of components, data flow, and the rationale behind certain architectural decisions. - Ensure Consistency Across Diagrams: If multiple diagrams represent different aspects of the system, ensure consistency in terms of symbols, notations, and style. This consistency helps in understanding the diagrams as part of a cohesive whole.
- Utilize the Right Tools: Use appropriate diagramming tools that suit your needs and are familiar to the team. Popular choices include Microsoft Visio, Lucidchart, or Draw.io.
- Facilitate Collaboration and Feedback: Engage various stakeholders in the creation process. Gather feedback to improve the accuracy and effectiveness of the diagrams.
- Ensure Accessibility: Make your diagrams accessible to all team members, including those with disabilities. This might involve considering color blindness and ensuring that the text is readable.
- Security and Confidentiality: Be mindful of the sensitivity of the information depicted in the diagrams. Limit access to these documents as necessary to maintain security.
- Training and Familiarization: Ensure team members are trained in reading and creating these diagrams. Familiarity with the symbols, notations, and conventions used in your organization's diagrams is crucial.
- Integrate with Documentation: Embed or link these diagrams within relevant technical documentation for easier reference.
| The practical implementation of technical architecture diagrams is pivotal in streamlining and enhancing various system design and communication aspects within software development and IT projects. Key to this effectiveness are practices such as clear objective definition, audience-tailored complexity, adherence to standard notations, simplicity and clarity, regular updates, and thorough documentation. By adhering to these best practices, technical architecture diagrams become invaluable assets, providing clarity, facilitating better decision-making, and ensuring alignment between technological development and business objectives. |
Summary
Technical architecture diagrams are indispensable tools in software development and IT infrastructure planning. They play a critical role in illustrating the structure and interconnections of various system components, ranging from hardware and software to networks and data flows.
These diagrams serve as vital communication aids, bridging the gap between technical and non-technical stakeholders and ensuring a shared understanding of the system's architecture. They facilitate effective planning, decision-making, and problem-solving by providing clarity and insight into complex systems. Additionally, they aid in risk mitigation, resource management, and compliance with industry standards.
Despite their creation and maintenance challenges, such as managing complexity and ensuring continuous updates, their benefits are substantial. Effective implementation of these diagrams, guided by best practices like precise objective setting, audience-specific detailing, and regular updates maximizes their value. Ultimately, technical architecture diagrams are more than just visual representations; they are foundational elements that support the entire system development and management lifecycle.
FAQs
A technical architecture diagram visually represents a software system's structure, components, and interactions. It provides an overview of the architecture of a system and can include various aspects such as application architecture, integration architecture, and data architecture.
Technical architecture diagrams play a crucial role in software development as they help developers, architects, and stakeholders understand a system design's overall architecture and data flows. They are used to communicate architecture designs and deployment architectures among team members.
There are various types of architectural diagrams, including software architecture diagrams, system architecture diagrams, deployment diagrams, and microservices architecture diagrams. These diagrams provide a high-level view of a system's architecture patterns and software components.
Technical architecture diagrams are essential in system design as they help understand the architecture patterns, data flow, and interaction of software components. They also assist in DevOps architecture and deployment architecture planning, enabling effective development and integration of software systems.